Transform Your Trading Journey
Unlock the potential of stock trading with clear signals and expert risk management tailored for US investors.
Discover Our Powerful Tools
WELCOME TO DreamTai
DREAMTAI is an easy to use Stock trading software that advises you when to BUY/SELL stocks so as to maximize your profits and minimize your risk.
For US stocks ($ 19.99 only )
Explore the innovative features designed to empower your trading experience and enhance your investment journey with confidence.
FEATURES
Instantly
conducts online analysis of the stock trend .Precisely
identifies clear entry and exit signals and the number of shares to trade.Automatically
downloads free End of Day price data for your selected stocks.Displays
precise BUY/SELL signals visually.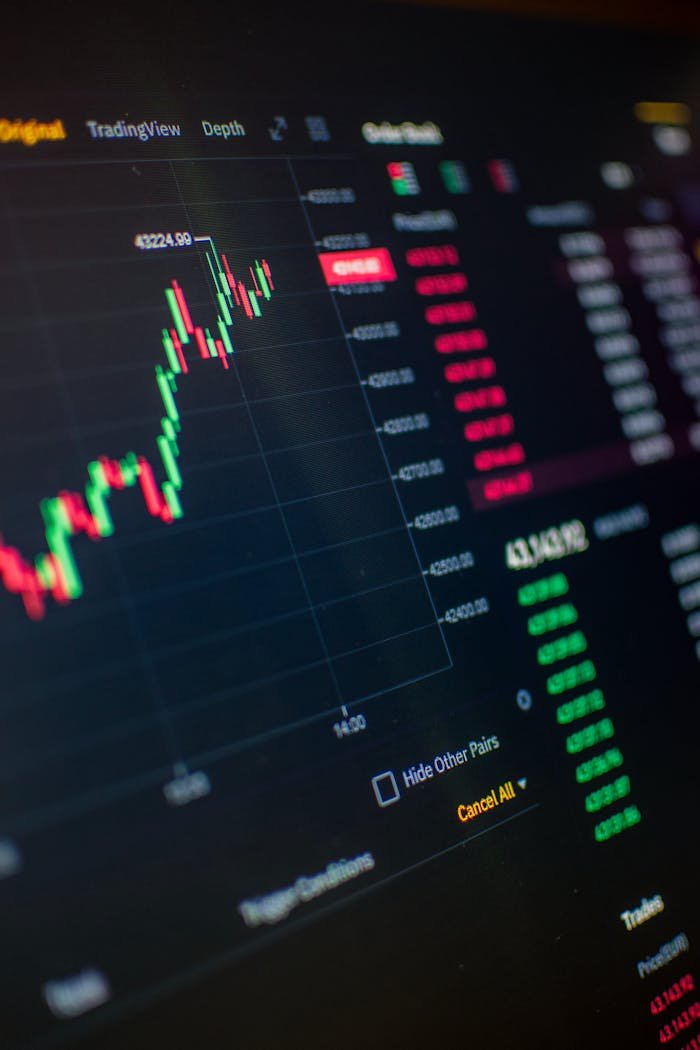

The Vision Behind DreamTai Software
With decades of experience in the financial sector, DreamTai Stock Trading Software has continuously evolved to meet the needs of investors. Our team consists of seasoned experts who understand the intricacies of stock trading and are dedicated to simplifying the process through innovative technology. We pride ourselves on our deep market insights and commitment to helping our users succeed.
Experience Unmatched Trading Support and Tools
DreamTai Stock Trading Software is very easy to use.
If the latest price bar in the chart is GREEN, then the stock trend is up and you should buy the stock, and if the price bar color is RED then the stock trend is down and you should sell the stock.
How easy is that? It can not get ANY easier than that.
Also, DreamTai helps you in controlling your risks by automatically calculating how many stocks to buy/sell in your portfolio.
Frequently Asked Questions
Does this program work with Canadian/US/UK/Australia or some other stock market ?
How does DreamTai work ?
But the key idea is to maximize our chances of winning trades and minimize our losses and minimize our risk.
Here is how DreamTai trading software works.
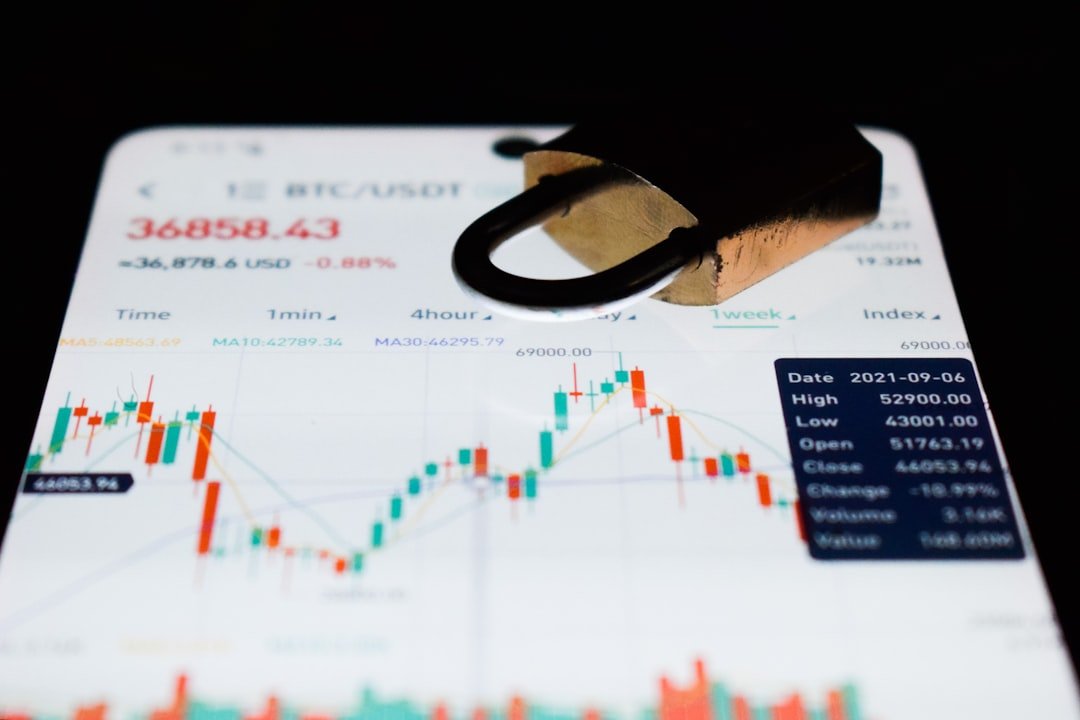
DreamTai analyzes the stock in two ways. First, it downloads the past historical stock data and checks the historical trend and tries to predict if the trend is changing.
It displays the results of the analysis as a stock chart, in which the stock price bar is colored green if the trend is up and is colored red if the trend is down.
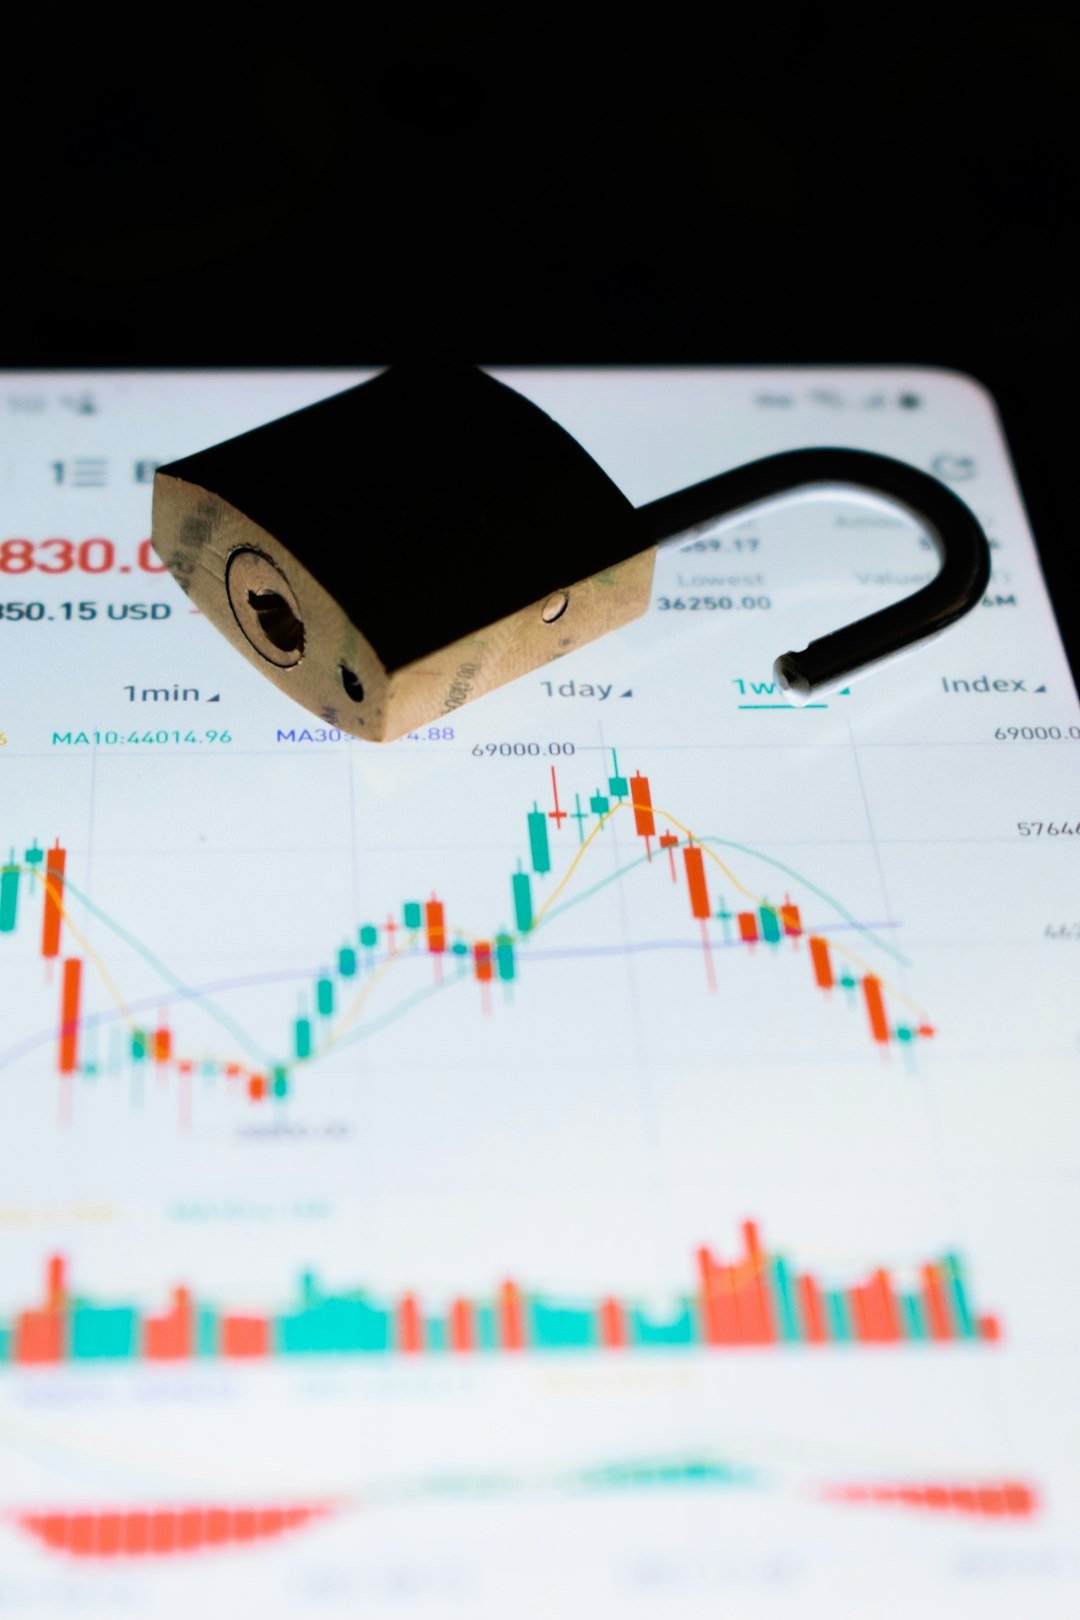
Also, DreamTai analyses the volume of the stock and checks if the volume of buyers is more than the volume of sellers. It displays this result as Power Ranking. You can compare different stocks by comparing their Power Rankings. If the Power Ranking is positive, there is more demand for the stock. If the Power Ranking is negative, there is more selling by the sellers.
However, we want to be more sure and increase our chances of success..So we consider the buying volume..which is Power Ranking
If it is more than 3 then there is higher buying pressure..
Now, to decrease our risk further, DreamTai sets the stop loss and quantity of shares to buy, such that if the trade turns against you, you can lose MAXIMUM two percent of your capital. So, with the stop loss, you are further protected against downward movement. So, we aim to have more winning trades than losing trades.
Do you publish the track record of DreamTai ?
I prefer not to publish such misleading and fake information. I think that each investment decision is unique with reference to the stock and the time period within which the investor invests.
For example, if a person had purchased ANY Dot Com stocks in the period 1998 to 2000, he would have earned a HUGE amount of money on his original investment. That does not mean that he is an Investment Guru or Genius. On the same scale, he would have lost a HUGE amount of money if he invested in Dot Com stocks after 2000.
So, success is the matter of right time and the right stock … hard work and a little bit of luck.. BUT, I can explain to you how DreamTai works and how you can use it to help you make profitable investment decisions.
Dreamtai analyzes the trend of the stock and also the buying volume of the stock.
The Power Ranking feature of DreamTai sorts the stocks of your portfolio based on bullishness strength. Based on this analysis, DreamTai presents the results to you. DreamTai does not automatically place a trade. It just presents its analysis and waits for you to make the buy/sell decision. It also shows you how much to risk per trade.
What is your return policy ?
That means you get 60 full days to “test drive” this trading software and if you ever do want a refund it’s on its way – no hassles and no questions.
Why should I trust you ? Can you convince me why I should buy this item from you?
As an investor, I have tried many many courses and software but did not find them satisfactory. I could not make any money trying the techniques mentioned in those courses. So, I created my own software after studying the stock price patterns. Yes, DreamTai Stock Trading Software is a tool which I had made for myself and found it useful. So, I made it available for all investors at a very reasonable price.
I have tried day trading, short term trading, hundreds of fancy indicators, trader chat rooms, trader subscription services, analyst reports.
I found that it is possible to make money if I invest in stocks of companies with good fundamentals like Apple, Microsoft which are trending up. DreamTai is meant for this type of trading: Trend Trading of companies with good fundamentals.
It is not meant for day trading or for penny stocks trading. Most day traders lose money.
I do not promise you that you will make millions, but I am confident that you will find DreamTai software very useful for selecting and timing stock trades and getting out of the trades at the right time and in managing your risk.
I have been selling DreamTai since 2002.
You can check my Ebay feedback page to see feedback from hundreds of satisfied customers.
If any customer is unsatisfied, he/she just has to contact me for a full refund ( Just inform me within 60 days of purchase).
After your purchase, I will send the download links within 24 hours.(US customers only)
Please feel free to ask any other questions you have…whether it is about installing DreamTai or about trading or anything else.
Are there any stock price data charges ?
DreamTai has a datafeed which has monthly data subscription charges of $5 per month.